GDP per capita graph
Click image for enlargement
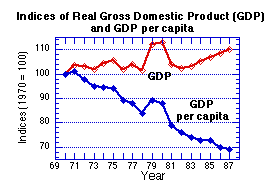
Hard times: The per capita gross domestic product dropped 2.2% per year during the 1970s and 1980s, amounting to a large total drop in effective incomes. The country has been subjected to World Bank/IMF Structural Adjustment programs which have seriously affected lower income people.


|
Contents:
1.René relaxing
2.Children
3.Tomb
4.Old fortifications
5.Village scene
6.Rainforest rice paddy
7.Transplanting rice
8.Dry rice tavy
9.Ranomafana tavy
10.Andasibe tavy
11.Vanilla orchid
12.GDP per capita graph
|